Rent Madness
Why is America’s rental data so bad, why does it matter, and what can we do about it?
Explore the dataBy Timi Koyejo and Arjun Kakkar
Editing by Biniam Gebre
Design by Chloe Phan and MaSara Myers
Think back to your last move. It probably evokes memories of anxiety, dread, and sweat. Summer is the season most of America’s 44.5 million renter households move. Last year roughly 17 percent of renters changed addresses. While finding new housing is stressful for all renters, housing searches can be particularly grueling for low-income families.
50.4% of all renter households were cost-burdened in 2022.

The post-pandemic rise and fall in inflation has brought sharper attention to prices in a variety of economic sectors—including grocery, transportation, and child care—and apartment rents are no exception.
Despite making up a significant portion of Americans’ expenses, comprehensive and accurate data on rent prices is surprisingly scarce. In the U.S., rental data is calculated in a complicated and disjointed manner. There are multiple governmental and private-sector rental datasets that substantially diverge, often with differing methodologies.
Messy rental data has a real impact on addressing the affordable housing crisis in U.S. cities. Government officials not only use these data to develop rent standards for housing assistance programs—but also to geographically target affordable housing programs or decide whether to pursue regulations to address the displacement of low-income residents. To adequately address the housing crisis, accurate data is essential.
The Real Stakes of Bad Rental Data
One vivid example of these dynamics is the story of JoAnn Ellis, a soon-to-be grandmother living in the booming Phoenix metro area in 2021.

As reported by the Arizona Republic, JoAnn struggled throughout her life with housing insecurity, but in 2021 she finally got off a lengthy waitlist and received some government help.
Relief came in the form of the federal Housing Choice Voucher program, which assists low-income renters in finding housing on the private rental market. It pays the difference between what they can afford (usually set at 30 percent of their income) and the full rent of a moderately priced rental unit.
However, relief soon turned into despair. JoAnn spent five months searching for an apartment, but she could not find a unit in her budget and with a landlord accepting vouchers. Housing vouchers operate under a use-it-or-lose principle and voucher holders are given a limited time for their searches. After JoAnn’s voucher expired, she was forced to move into a crowded rental with her pregnant daughter’s family.
Crucial context for JoAnn’s story is the rapid rent increases in Phoenix at the time. Market rents in the Phoenix area are reported to have risen nearly 30 percent between 2021 and 2022, faster than the rental payment standards of the federal government.
Rental statistics are not just background details. How rental data are measured, aggregated, and reported directly influence the housing outcomes of renters like JoAnn. If the data the government uses to set rental assistance amounts do not match the reality on the ground, people can go unhoused.
It might appear as if we have a clear grasp of rental housing costs given the frequency with which these statistics are cited in housing conversations, but looking under the hood of rental statistics, one can see a much fuzzier picture.
Nationwide Rent Tour
There are many sources of rental data but only a few are publicly available and cover many parts of the country. We focus on Zillow ZORI data and ACS to build the start of a Rent Transparency Index.
Using these two data sources, we analyze discrepancies in rent prices between them, and categorize zip codes into six categories ranging from “no data available” to “the different data sources are within a reasonable range of each other.”
When zooming into Phoenix, notice the dark yellow zip codes in a few regions of the city. These are places where the rental prices can differ by almost a factor of two from one data source to another.
Next, we go to San Francisco—a city that regularly ranks as one of the most expensive in the country for renters. Looking to the southwest, the Bayview neighborhood, colored in deep brown, has the largest rent discrepancy in the city and is also one of the most disadvantaged. Sometimes referred to as the “Last Black neighborhood of San Francisco,” it’s an ongoing site of struggles over gentrification and displacement.
In some parts of the country, one can see a clear spatial distribution of rent discrepancies, such as the Atlanta metro area. Rent discrepancies are apparent in central city areas as well as in a ring of zip codes that surround the outlying areas
The absence of rental data is also a significant concern, especially in rural areas. Sparsely populated states like Montana have limited rental data on private apartment listing websites outside the larger cities like Bozeman.
Explore Rental Data Disparities
These disparities can be unexpected and vary drastically based on geographic, economic, and social factors. Explore your city and zip code to see what average rents and data availability look like.
Search your city
Bad Rental Data has Policy Implications: Fair Market Rent
A case study in how rental data is used to set voucher levels.
When rental market information is inaccurate, it affects not just individuals like JoAnn but entire communities seeking affordable housing options through assistance programs. HUD’s Fair Market Rent (FMR) standards determine voucher amounts in different metro areas. They rely on Census ACS rent estimates, local CPI measures, and other adjustment factors to determine the maximum allowed rent levels.
HUD calculates the Fair Market Rent based on the 40th percentile of the gross rents paid by recent movers for non-luxury units meeting certain quality standards. If set too low, inaccurate FMRs can significantly harm renters by making housing harder to find. If set too high, they can waste valuable government resources.
Analysis by the Center on Budget and Policy Priorities, shown below, has suggested that HUD FMRs historically were set too low. To mitigate this problem, which was compounded by poor availability of ACS data due to COVID in 2021, HUD has begun supplementing public rental data sources with private rental data sources (Zillow, RealPage, Moody’s, CoStar, CoreLogic, Apartment List).
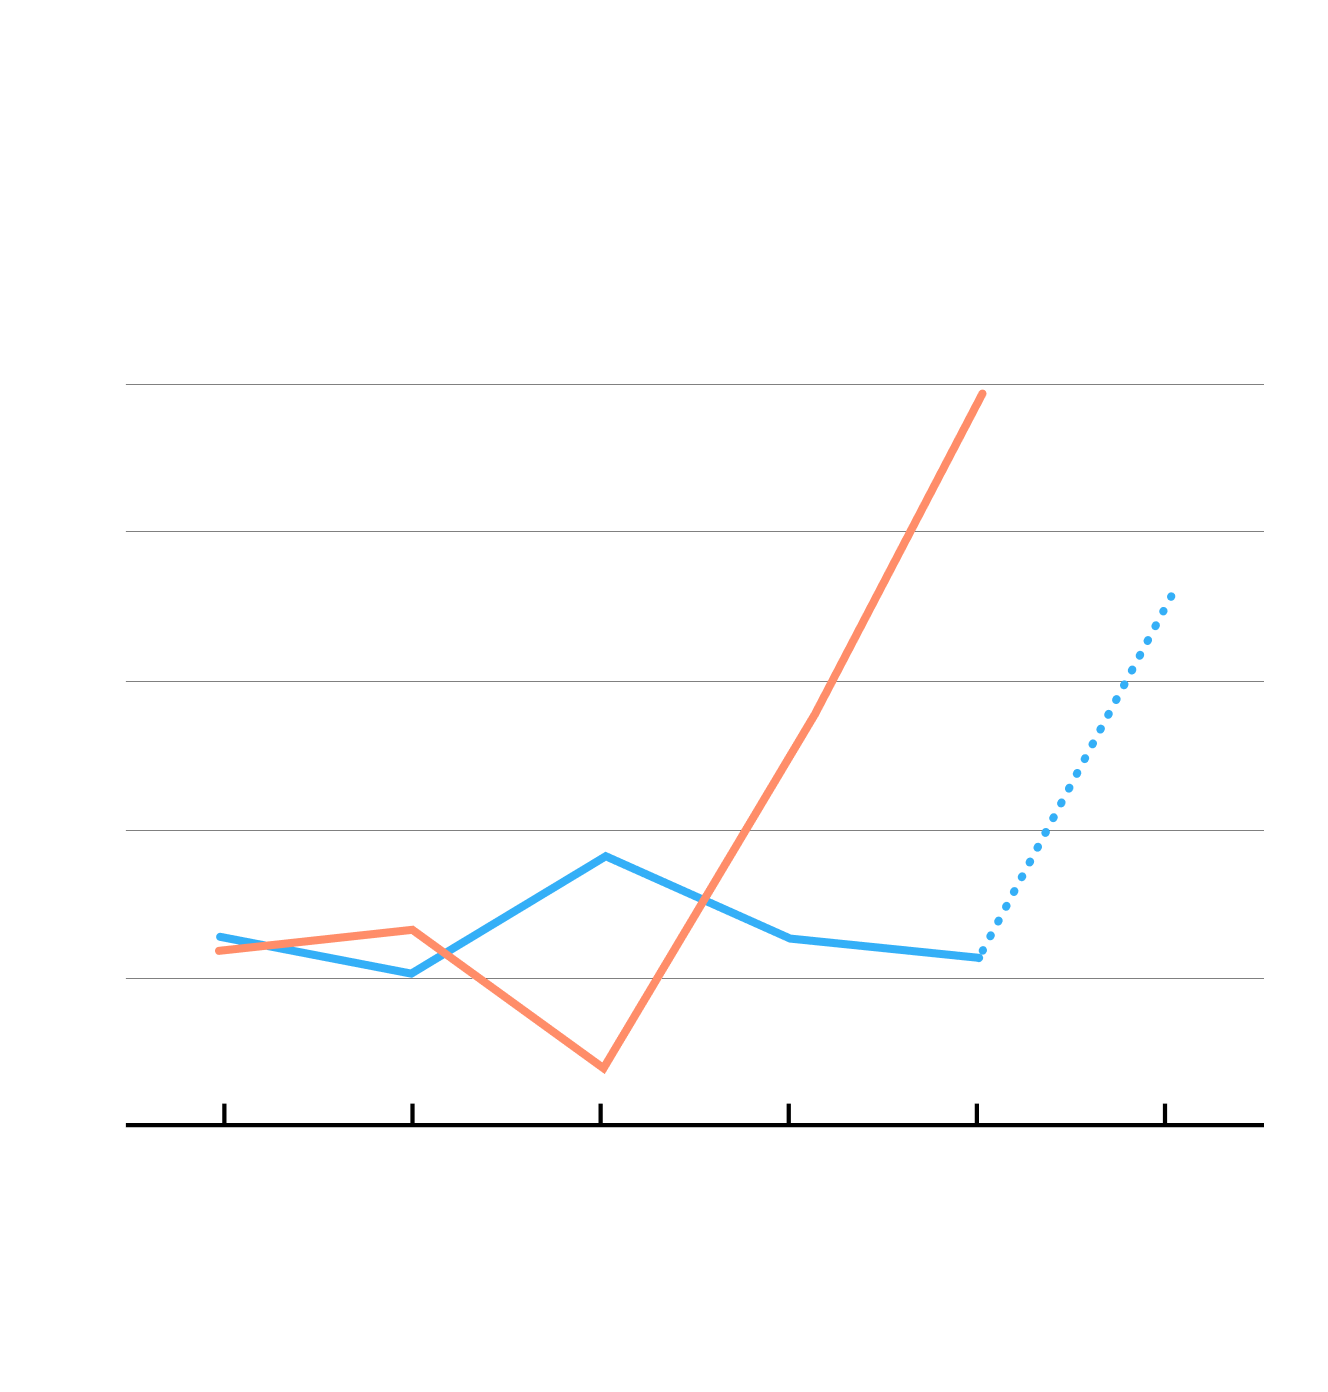
New Policy for 2023 Will Help HUD “Fair Market Rents” Catch Up With Actual Market Rents
Year-over-year change in rent estimates
14.8%
Zillow Observed Rent Index
HUD FMR
10.5%
2018
0
3
6
9
12
15
%
2019
2020
2021
2022
2023
Source: Replication of graph from Center on Budget and Policy Priorities, "New HUD Fair Market Rent Policy Can Help Local Agencies Reduce Homelessness and Expand Housing Choice," 2022. Data and analysis by CBPP.
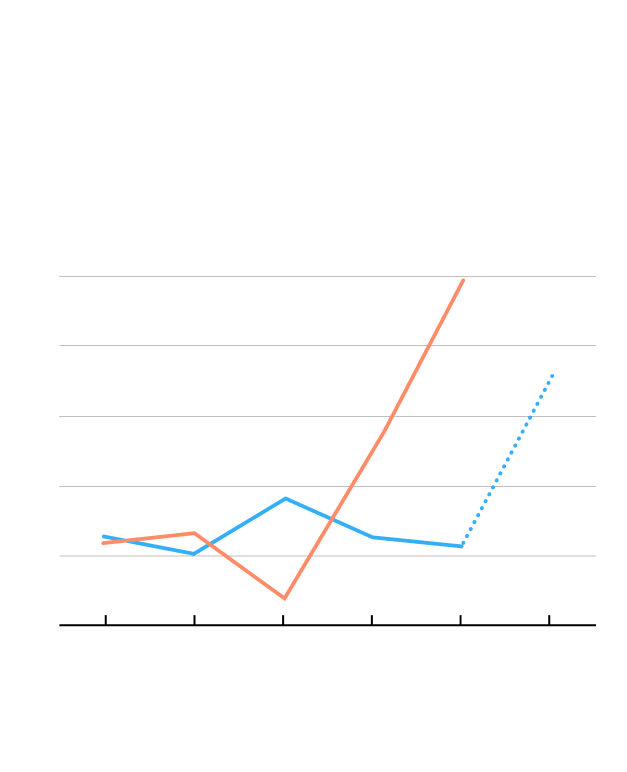
New Policy for 2023 Will Help HUD “Fair Market Rents” Catch Up With Actual Market Rents
Year-over-year change in rent estimates
Zillow Observed Rent Index
10.5%
14.8%
2018
0
3
6
9
12
15
%
2019
2020
2021
2022
2023
HUD FMR
Source: Replication of graph from Center on Budget and Policy Priorities, "New HUD Fair Market Rent Policy Can Help Local Agencies Reduce Homelessness and Expand Housing Choice," 2022.
Rental data accuracy does not only concern policymakers. Researchers use rental data to study empirical questions on neighborhood change, such as if new construction of market-rate apartments causes rents in the surrounding area to increase or decrease. Rental data is also used by residents and neighborhood activists as they engage in politics, whether it be campaigns for tenant protections or debates over proposed zoning changes.
The low quality of rental data is even more striking when compared to the high-quality, granular records on home sale transactions. In many communities, one can find the sales price of a home because property transactions must be recorded in public registries.
Types of rental data sources
There are three primary types of rental data: public data, apartment listing websites, and commercial proprietary data brokers. Each data source has different strengths and limitations, shaped by frequency and timeliness of updates, level of geographic granularity, degree of sample completeness and availability of data.
Depending on the analytical question at hand, different rental data sources are better suited than others. For example, public data sources are well suited for analyzing rents paid by all renter households—including both new and existing leases. But if you’re interested in the experiences of people currently searching for an apartment, listing websites or commercial broker data provide more timely insights.
Sources Sources | Timeliness | Geographic Granularity | Sample Completeness | Availability |
|---|---|---|---|---|
Public data sources (Census ACS, BLS) | 1-2 year lag in new ACS Census data. Depending on ACS geography, must use 1-year or 5-year average estimates, resulting in poor time resolution for small geographies. | Only geographic aggregate statistics: census block group, census tract, zip code, city, county, MSA, state, etc. No individual unit information. | Existing and new rental contracts. Representative survey of 3.5M U.S. addresses. | Publicly available, with historical microdata. |
Apartment listing websites (Zillow, Apartment List, Realtor.com) | Up-to-date/monthly statistics available. | Aggregate data at zip code level, city, or MSA. Unit level data not available to the public. | New rental contracts/asking rents. Limited information on the lower-cost rental market segments that are not professionally managed. Biased to include higher cost units and properties listed on their websites. | Publicly available aggregated data from when collection started. |
Commercial proprietary data brokers (CoStar, RealPage) | Up-to-date/monthly statistics available. | Aggregate data and unit level data. | New rental contracts/asking rents. Traditionally surveys of medium-to-large apartment property owners (for example, 50 units or more). Tend to have limited information on the lower-cost rental market segments that are not professionally managed and bias towards higher cost units. | Private data source available for purchase. |
How Do Rental Data Sources Diverge And Why?
The degree of disparities between rental data sources can be seen when comparing rent estimates from the Census ACS and Zillow. For example, compare the zip code level median gross rent estimates from the ACS and the zip code level rent from Zillow as shown in our map. Zillow Observed Rent Index (ZORI) tracks changes in asking rents over time, with adjustments aiming to control for changes in the quality of the available rental stock. Looking nationally among zip codes with both ACS and ZORI rent estimates, the ZORI index is usually significantly larger, with the median gap of 23.6 percent.
Rent Disparities in Phoenix
Looking at the actual rent measures across zip codes, the disparities in prices jump out for particular neighborhoods.
Median rent from ACS
Mean ZORI value
Price disparity
Maryvale
85017
Sky Harbor Area
85034
Maryvale West
85031
South Mountain
85041
South Phoenix
85040
Maryvale South
85033
Downtown Phoenix
85003
Estrella
85043
Garfield/Eastlake
85006
Arcadia
85018
North Mountain Village
85051
South Mountain Park
85042
Desert View
85050
Central Phoenix/Encanto
85013
West Phoenix
85037
East Phoenix/Green Gables
85008
Paradise Valley Village
85032
Maryvale East
85035
Central City/Evans Churchill
85004
Camelback East/Biltmore
85016
Moon Valley
85022
North Central Phoenix
85021
Deer Valley
85023
Alhambra
85015
North Phoenix
85027
Midtown Phoenix
85014
Northwest Phoenix
85053
Norterra
85085
Sunnyslope
85020
New River/Desert Hills
85086
Central Corridor
85012
Ahwatukee North
85044
Ahwatukee South
85048
Desert Ridge
85024
Desert Ridge/Mayo Clinic
85054
North Mountain
85029
Capitol District
85007
West Phoenix/Central City
85009
West Phoenix/Maryvale
85019
Paradise Valley/Mountain View
85028
Ahwatukee Foothills
85045
Sonoran Desert Preserve
85083
A major source of difference between these two rental data sources is the composition of the sample. Specifically, whether the universe is only new rental contracts or all existing rental contracts (both new and old). This is an important distinction between public and private data sources. Given that rent prices have generally increased, rental data sources with only new contracts systemically report higher median rents than those with all existing rental contracts.
Moreover, these gaps in rental data seem to have at least some structural components. While beyond the scope of this analysis, it would be informative to assess the degree that socio-economic or demographic factors at the zip code level (lower median incomes, older housing stock, and higher proportion of renters) are correlated while controlling for other confounding variables.
How can rental data be improved going forward?
We need to increase the awareness of the limitations in the existing rental data landscape. But knowledge alone is not sufficient. Given the importance of these data, more should be done to ensure their accuracy and timeliness. The following are four possible solutions to remedy the rental data challenge.
Despite deficiencies in current rental data sources, the U.S. is not starting from scratch. One of the most promising solutions would be to invest more resources in the public agencies already tasked with gathering rental data, namely the Census Bureau and the Bureau of Labor Statistics (BLS). Richer Census rental data is not a radical proposition—an existing example is the New York City Housing and Vacancy Survey (NYCHVS). Since 1965, the New York City has contracted with the United States Census Bureau to conduct the triennial NYCHVS, providing detailed housing statistics on the city’s housing stock, vacancy rate, distribution of rents, and more. The Census Bureau could extend a version of this survey to other major cities, with a larger sample and more frequent surveys to supply accurate annual rental data.
In addition to the Census Bureau, the BLS maintains another public rental data source that could be strengthened. The BLS measures rent inflation nationally by surveying a representative sample of housing units across selected metro areas. This is essential information—a data point HUD uses when setting FMRs. Extending the survey to track rent inflation at a more granular level in the top 50 largest cities would be a promising possibility.
Conclusion
In summary, the data sources we use help us understand and interpret the world around us. For most people, housing is their largest budget item. Their rent is a number ingrained in their psyche. Yet at a system level, tracking rent is more complicated than one might expect. A better understanding of how rental data is measured—and the limitations of this data—allows one to be more thoughtful in approaching the housing challenges faced across the country. But this is not only an academic question. Rental data has a direct link to key elements of our social safety net and needs to be taken seriously and measured accurately.
Data Methodology
The story uses two primary sources of data, the American Community Survey (ACS) and the Zillow Observed Rent Index (ZORI). For pricing data with the most coverage and highest degree of geographic granularity, we use the median rent estimates from the 5-year ACS (2018-2022) by zip code. We calculate the mean ZORI value by zip code over the same interval to ensure as fair a comparison as possible. This leaves us with 4448 zip codes with data from both measures over the 5-year period, covering 48.4% of the US population.
All comparisons, including the “Rent Disparity” are done by treating the ACS as the base price and measuring percentage or absolute difference from this price.
Citations
Acknowledgments
We would like to thank Carol Galante for their comments on previous drafts.